
Product Release: Saved Queries, Labels, and Timeline
Users can now save complex queries on-platform, add custom tags to content, actors, and contexts, and use new Timeline views to visualize research.

TLDR
Open Measures is introducing two workflow enhancements: Saved Queries and Labels. As a bonus, we’ve also added new Timeline functionality.
Saved Queries lets researchers preserve complex search queries for future use.
Labels allows users to tag content (posts and replies), actors (users), and contexts (channels or groups) using custom categories.
Both can be saved on-platform, saving analysts time and streamlining complicated research collaborations.
Each of the above are rolled out to Pro and Enterprise users. Get in touch to get access to these new features.
Background
The Open Measures team is excited to introduce Labels for organizing and tracking what matters, Saved Queries for faster and more consistent analysis, and expanded Timeline functionality to make comparing trends easier without losing detail.
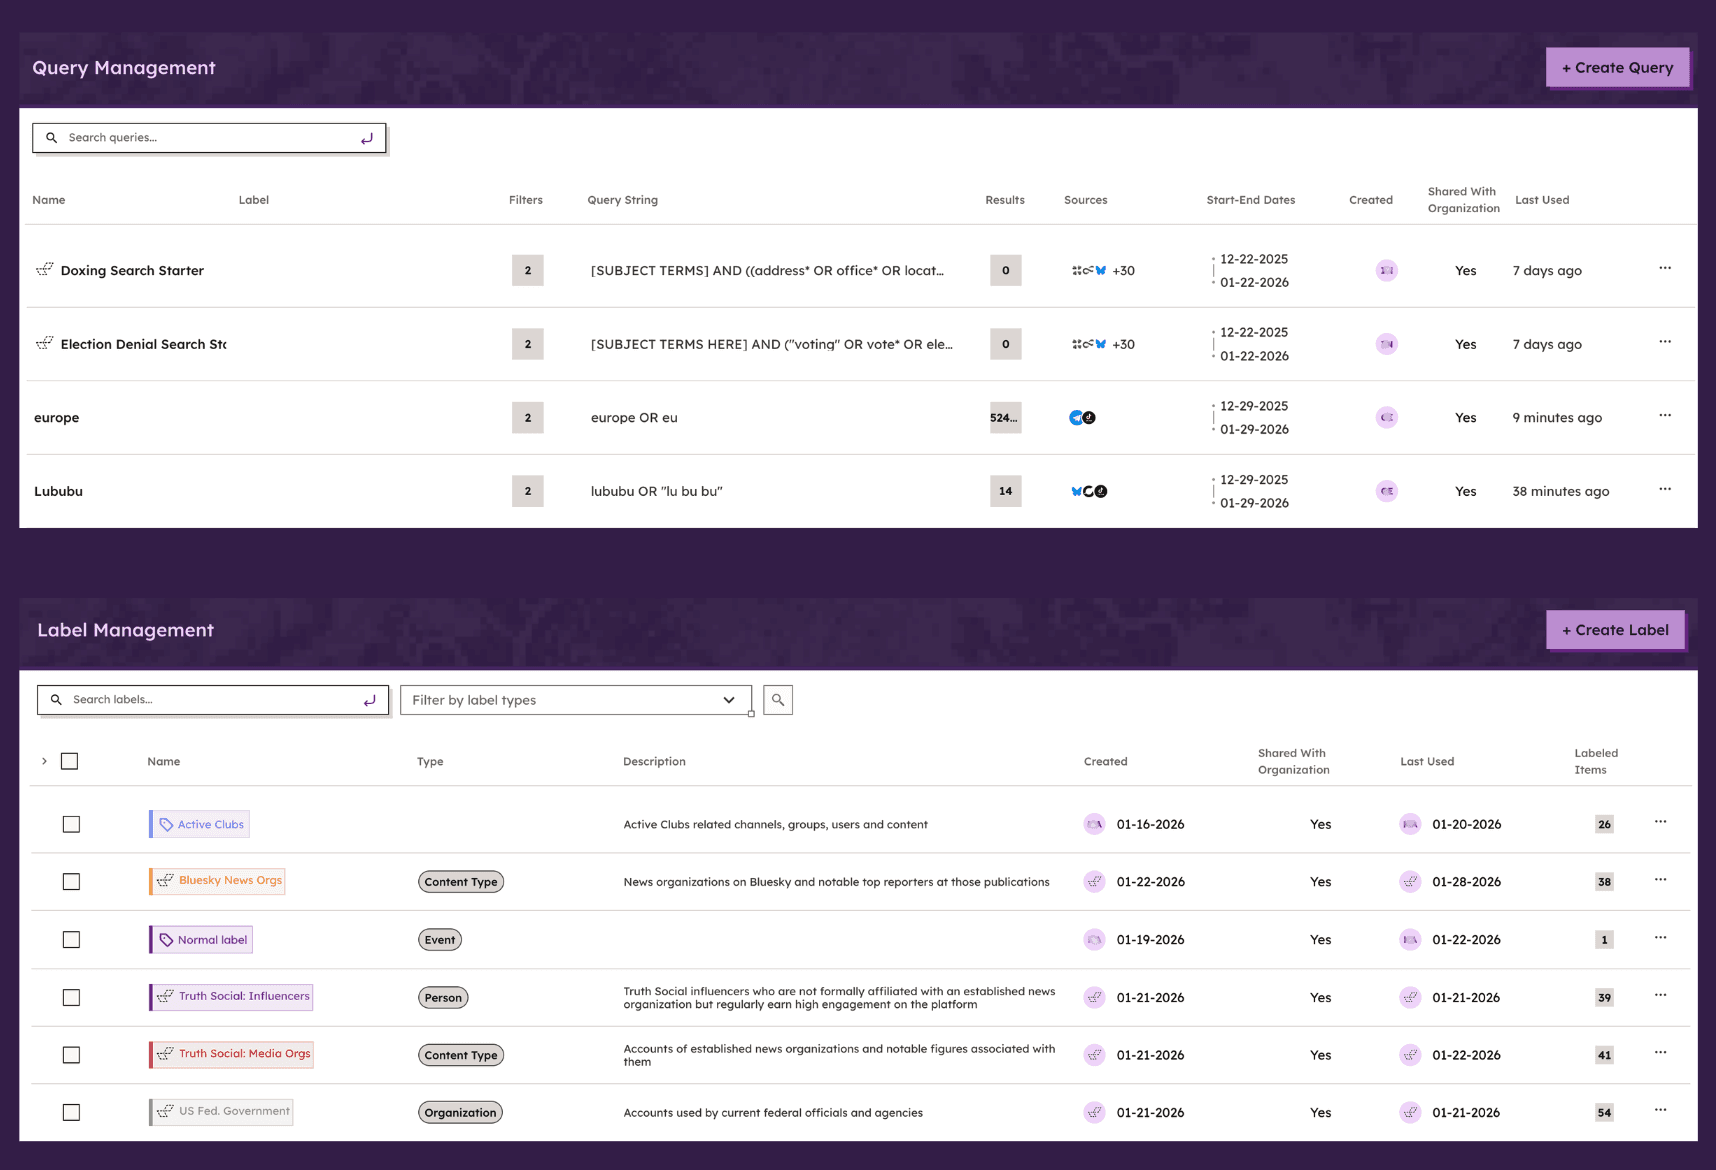
Caption: The new Saved Queries and Labels interface enables researchers to organize searches, classify content, and maintain consistency across team workflows.
Used together, these features make complex research projects significantly easier without requiring researchers to change their existing workflows. Below, we’ll walk through the uses of each one.
Labels: Organize and Track What Matters
With Labels, users can now add custom tags to content (posts and replies), actors (users), and contexts (channels or groups) with just a few clicks.
We designed Labels to help analysts organize long-running investigations, track multiple ideas at once, and reduce the mental overhead of complex research projects.
Key Capabilities
Labels transform scattered observations into structured datasets, making it possible to track patterns, measure prevalence, and generate reports based on researcher-defined criteria:
Privacy: Labels can be kept private or shared with a team.
Filtering: Labels can also be used as filters, allowing teams to surface content they’ve already classified.
Custom taxonomies: Create labels to organize specific research frameworks (e.g., “State Media,” “Coordinated Activity,” “Health Misinformation”)
Labels intend to help analysts isolate their own patterns from large datasets without creating extra work and without having to adapt to any default insights that other platforms sometimes impose. To help analysts get started, however, we’ve saved a few labels to the research dashboard that are available globally to help with research on common topics.
As we refine this feature, we see potential for better classification of common topics, users, and channels to help teams organize at scale without losing precision.
Saved Queries: Return to Work Instantly
Long-term projects often require research teams to reuse complex queries (long concatenations of keywords, phrases, date ranges, sources, and filters).
Now, analysts can save queries directly on-platform, making each one reusable to enable faster query iteration and cross-team collaboration. With Saved Queries, analysts can remain aligned for more consistent analysis and much less duplicated effort.
Key Capabilities
We built Saved Queries with ongoing research projects in mind, particularly those involving disinformation tracking and threat monitoring:
Privacy settings: Queries can be saved privately or shared with your team.
Query iterations: Save multiple versions of complex searches as your research approach evolves.
Quicker pivots: Maintain and revisit multiple investigative threads at once without misalignment or wasted effort.
Timeline Updates: Customize & Stack
To round out this latest collection of platform improvements, we’ve also upgraded our Timeline to support plotting several queries at once on the same chart. Instead of toggling between searches, analysts can now see how conversations evolve in relation to one another at a glance.
We’ve also added stacked and unstacked line and bar chart views, giving researchers the ability to visualize broad trends against local peaks while preserving detail and context.
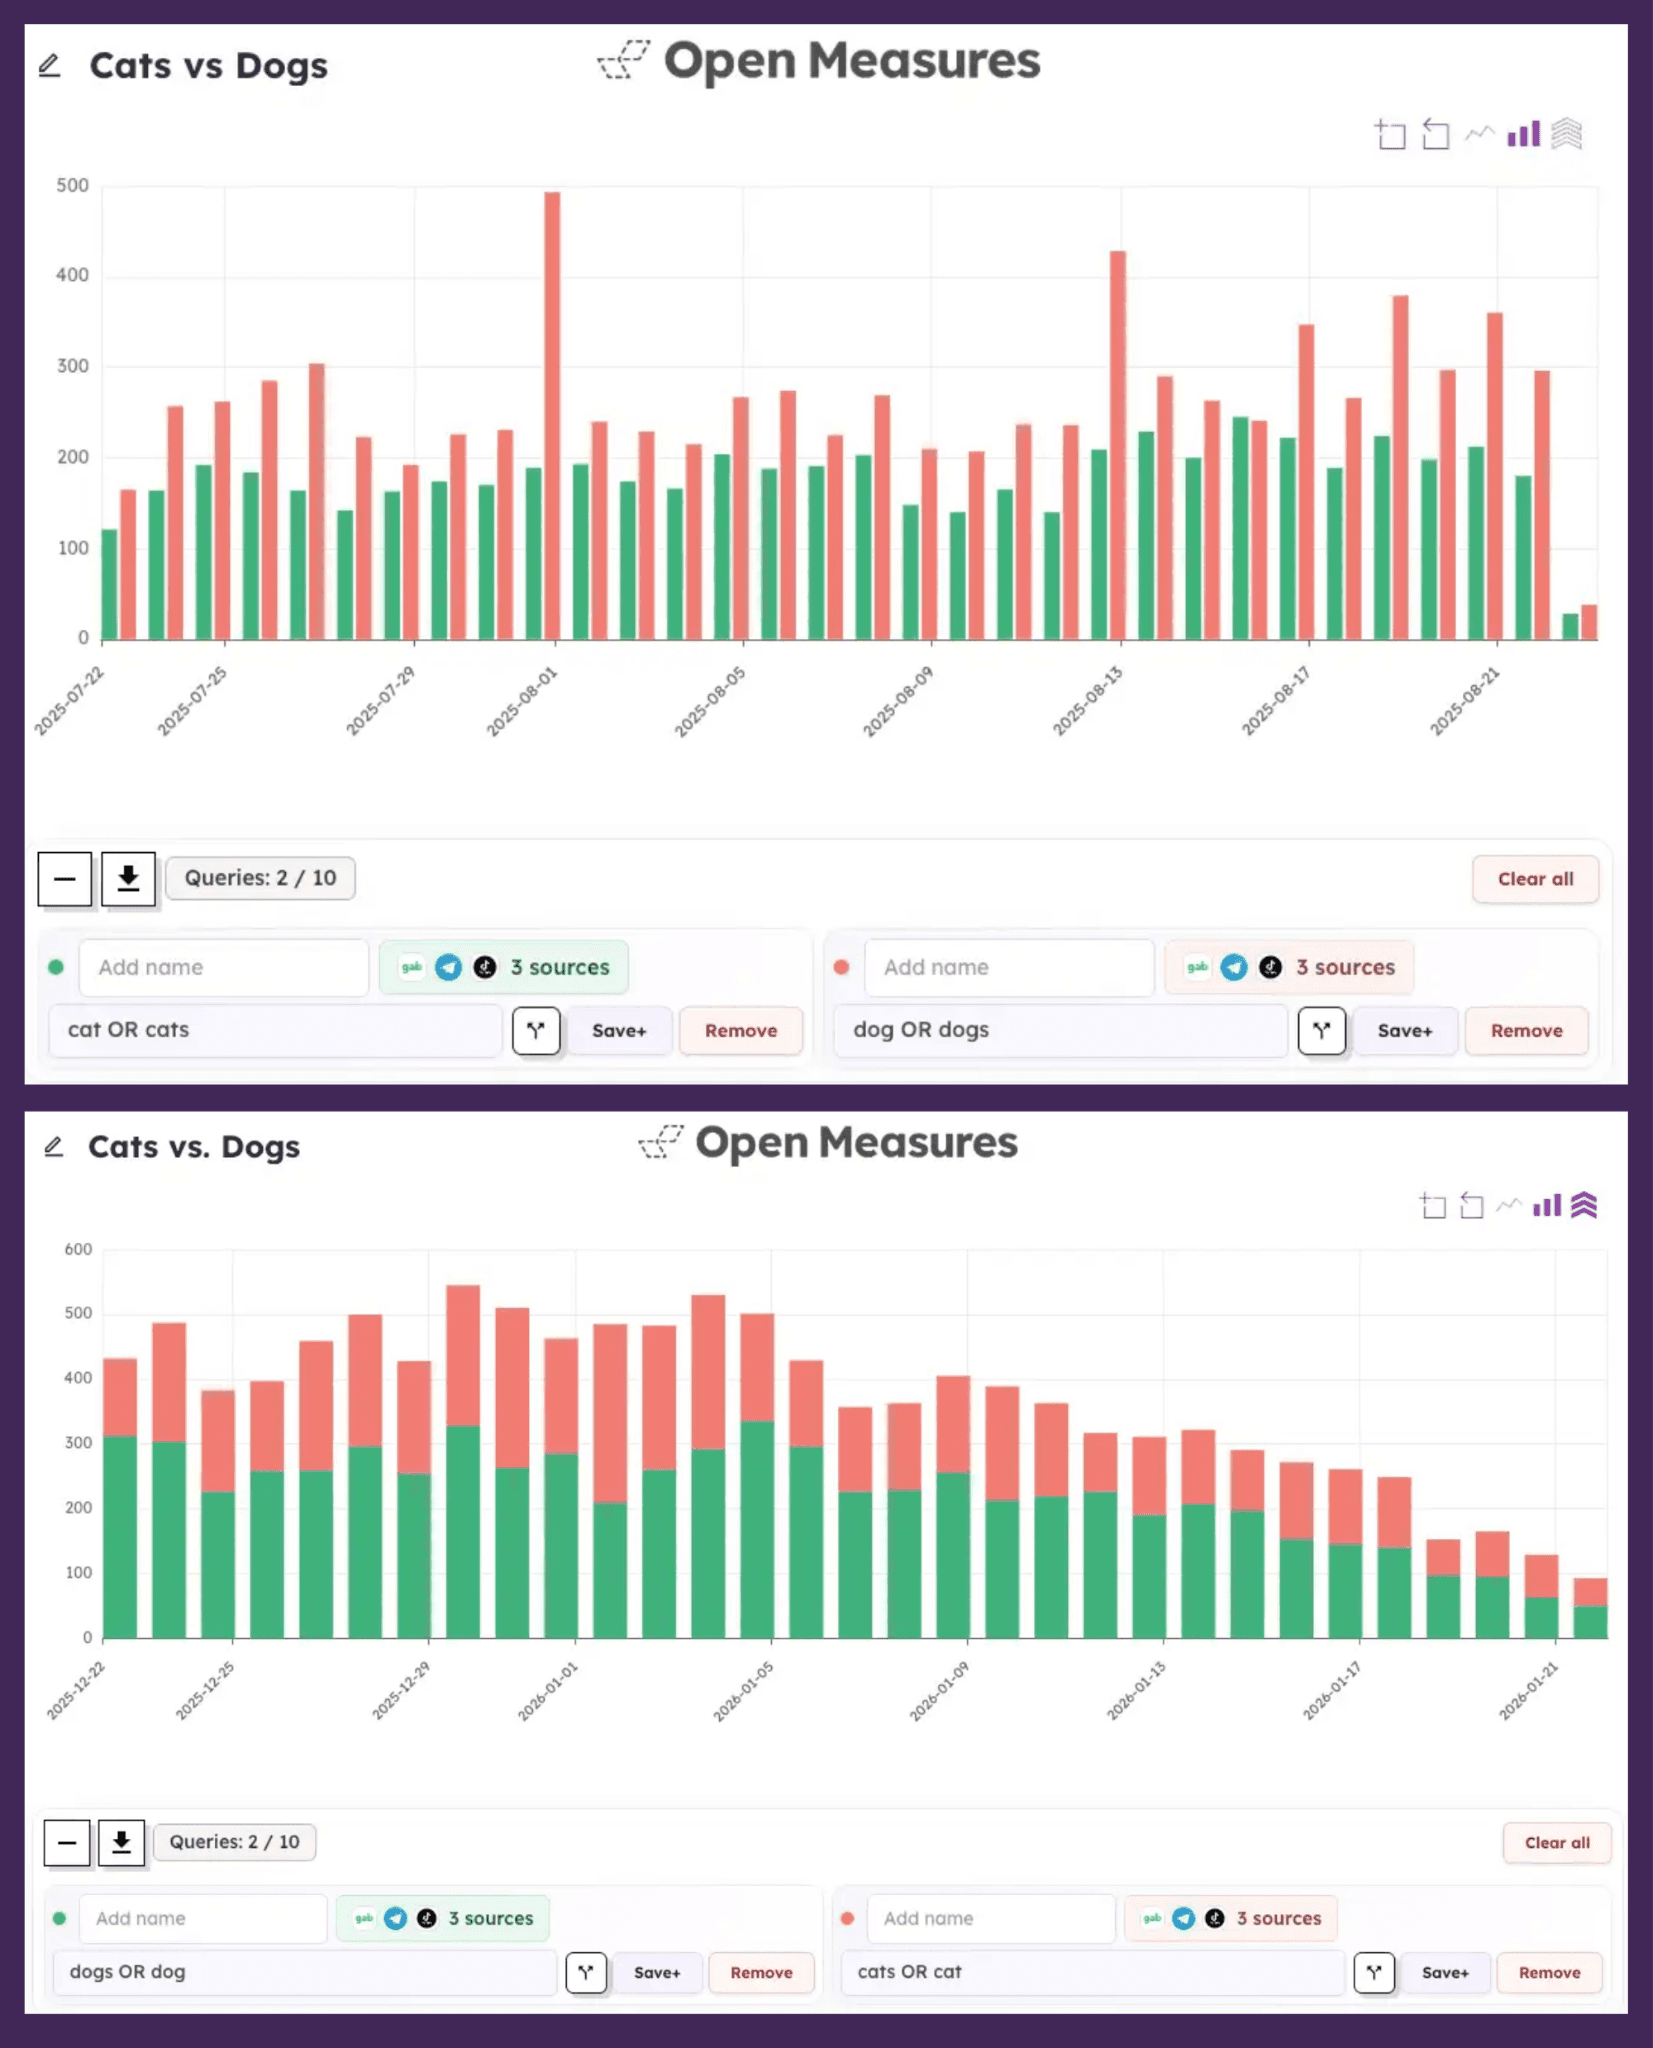
Caption: A comparison of Timeline bar charts plotting several queries at once, showing unstacked and stacked views. Stacked and unstacked views can be toggled on or off by clicking the stacked arrows icon (in the top right corner of each graph above).
Use Cases: Built for Modern OSINT Workflows
Together, Labels, Saved Queries, and an improved Timeline simplify many complex research processes.
Below are likely use cases and how our own researchers might approach them ourselves:
Tracking State-Backed Information Operations
Use Case: A research team investigating coordinated amplification networks around geopolitical events, monitoring dozens of accounts across multiple platforms while distinguishing between state media, unofficial amplifiers, and organic actors.
Saved Queries: Create and save queries for each set of actors and for specific time periods—staying organized while responding quickly as events unfold.
Labels: Apply “State Media,” “Verified Amplifier,” “Suspected Bot,” and “Organic User” labels to accounts as they’re identified to create a custom classification system – and filter by these labels to record the names of key actors.
Timeline: Plot query volume for each actor on one chart to see amplification spikes in sequence to determine whether different actors are moving in sync.
Impact: Consistent definitions maintained across analysts, reduced data entry, elimination of duplicated work, accelerated creation of new datasets and visualizations.
Brand Safety and Monitoring
Use Case: A corporation tracking the unauthorized use of its brand across alt-platforms, needing to distinguish between legitimate discussion, trademark infringement, and coordinated defamation campaigns.
Saved Queries: Brand safety teams save queries for official brand terms, common misspellings, and associated products, streamlining daily monitoring.
Labels: Flag content as “Legitimate Use,” “Trademark Violation,” “Counterfeit Product,” or “Coordinated Attack” to organize workflows and prioritize responses from legal and communications teams.
Timeline: Overlay brand mention volume against product launch dates or PR incidents to correlate spikes with real-world events and assess campaign effectiveness.
Impact: The company responds faster to brand threats, maintains audit trails for legal proceedings, and generates monthly reports quantifying different types of brand-related activity.
Election Integrity Research
Use Case: An academic research group studying voter suppression tactics across multiple elections and platforms, requiring systematic classification of thousands of posts by suppression technique.
Saved Queries: Create saved queries for each jurisdiction, time period, and suppression tactic type, allowing different team members to work on separate aspects without losing access to full research scope.
Labels: Label content by suppression technique (”False Voter Requirements,” “Intimidation Tactics,” “Date Confusion”) and targeted demographic to generate a structured dataset for quantitative analysis.
Timeline: Stack multiple suppression tactics on one chart to see which techniques peak closest to election day and whether they appear coordinated across platforms.
Impact: The team produces peer-reviewed research with reproducible methodology and shares datasets with other researchers to provide effective, evidence-based recommendations for election security policy.
Get Started
Labels, Saved Queries, and expanded Timeline functionality provide analysts additional support for the realities of OSINT work: large datasets, high-stakes decisions, and fast-moving investigations. Used together, these features reduce noise, improve collaboration, and make it easier to see big-picture trends and detailed analysis at once.
Saved Queries, Labels, and new Timeline views are now available to all Pro and Enterprise Open Measures users. All are also included in existing API functionality for programmatic access.
For teams wanting to develop shared taxonomies or integrate labels into automated workflows, schedule a demo to discuss options and best practices for your use case.
Identify online risks with the Open Measures platform.
Organizations use Open Measures every day to track trends related to networks of influence, coordinated harassment campaigns, and state- backed info ops. Click here to book a demo.